
The timeline
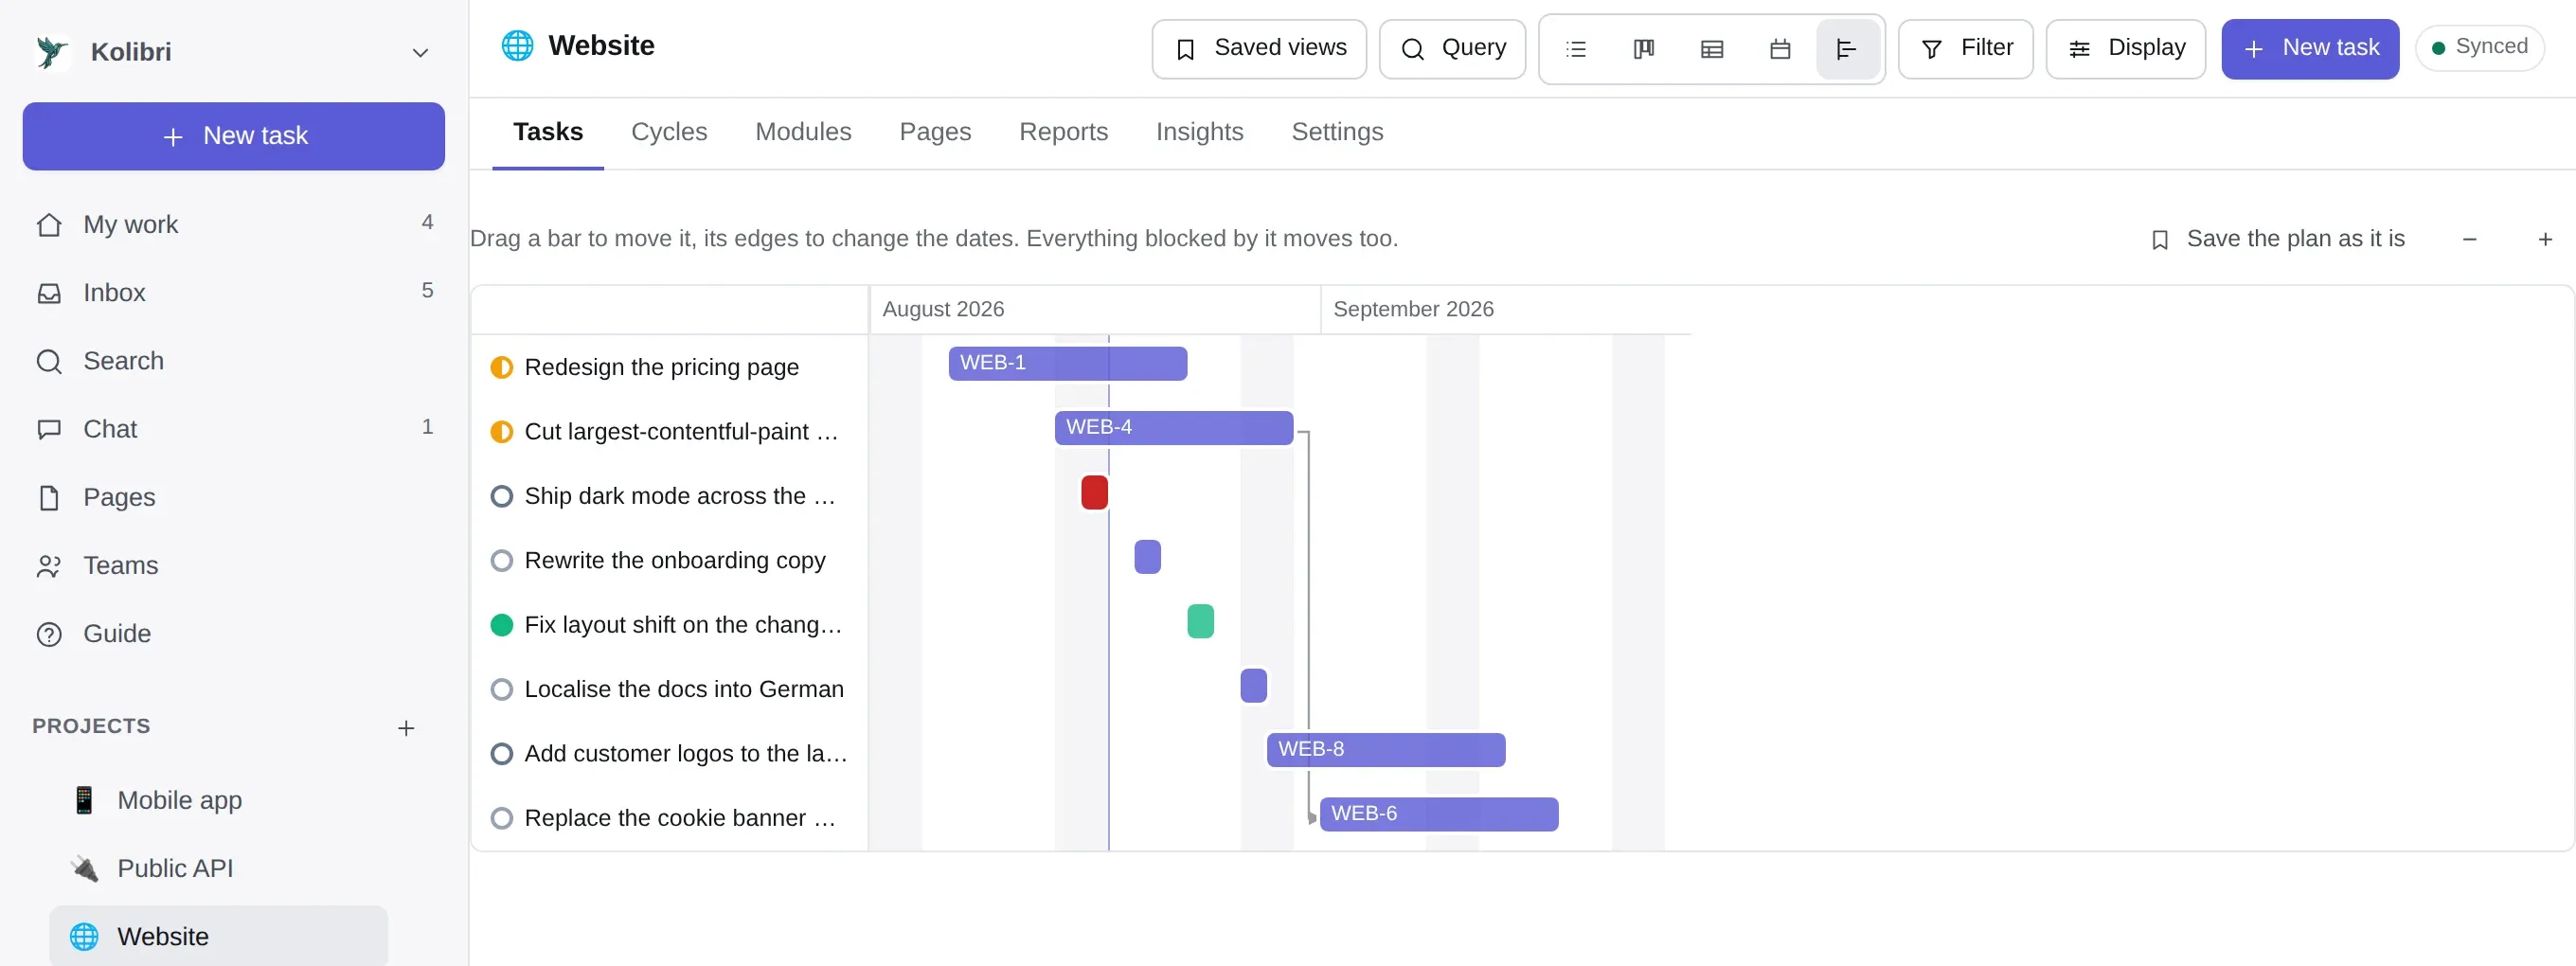
The fifth of the layouts on a project’s Tasks tab — the right-hand button in the layout switcher. Tasks as bars, drawn from their start and due dates, with the blocking relations between them as lines.
Because it is a layout rather than a screen, the filter and grouping you set on the board are still applied. A task with no dates cannot be drawn and is counted underneath instead.
Dragging moves what depends on it
Section titled “Dragging moves what depends on it”Drag a task later and everything it blocks moves with it. That is the whole reason this screen exists — a Gantt where the bars are independent is a picture of a plan, not a plan.
Three things make the arithmetic honest:
It counts working days. A task that takes three days and starts on a Thursday finishes on Monday. Which days the project works is a project setting, so a team that does not work Fridays gets a plan that agrees with them.
Each dependency can carry a wait. “B starts two days after A finishes” — for a review, a deploy window, something curing. The lag is on the relation, not on either task.
The server does it too. A date set over the REST API or by an assistant moves the plan exactly the way dragging does. If the rule only lived in the browser, an instance would have two answers to when does this finish and the wrong one would be the automated one.
Baselines
Section titled “Baselines”Save a baseline takes a snapshot of the current dates. From then on the timeline can draw it behind the live bars — the plan as it was, under the plan as it is.
That is the only honest way to answer are we late, because the alternative is remembering what the dates were in March. Save one when a plan is agreed, and save a new one when it is deliberately re-agreed rather than when it slips — a baseline that is updated every time reality moves is a baseline that can never show that reality moved.
Work-in-progress limits
Section titled “Work-in-progress limits”Set on a board column rather than here, but they belong to the same conversation. A column with a WIP limit turns its header when there is more in it than the limit. It does not refuse the drop.
That is deliberate: a limit that blocks the drop gets worked around within a week — cards parked in the neighbouring column, a second “actually in progress” state — and then it is measuring nothing. A limit that colours a header is a limit somebody argues about in a stand-up, which is what it was for.
What it does not do
Section titled “What it does not do”- No resource levelling. Kolibri does not know how many hours anybody has, so it cannot reschedule around a person being on two things at once. The team planner shows you that; it does not solve it.
- No critical path highlighting. The chain is drawn, and moving a task shows you what moved.
- No forecasting. Bars are where the dates say they are.
- Only blocking relations move things. Relates to and duplicates draw nothing here.
When it is overhead
Section titled “When it is overhead”Work with real dependencies — a migration, a launch, anything with a deploy window — is what this screen is for. Work that is a stream of independent tasks does not have a plan to draw, and maintaining start dates so that a Gantt looks tidy is pure cost. Most teams use the timeline for one project and never open it for the others.